Invest in Manitoba’s Fastest-Growing Region

As one of Manitoba’s fastest-growing municipalities, the RM of Taché is a premier destination for investors. Located minutes from Winnipeg, we perfectly balance rural affordability with metropolitan connectivity and a supportive business environment.
Tache Advantage

The Taché Advantage

Strategic Location. Growing Communities. Investment Potential.
The Rural Municipality of Taché is one of Manitoba’s fastest-growing municipalities, offering businesses and investors a strategic location, strong infrastructure, and a supportive business environment.
Located just minutes southeast of Winnipeg, Taché combines the advantages of rural affordability with direct access to major transportation corridors, a skilled workforce, and expanding residential communities.
With a growing population, new housing developments, and increasing demand for services, Taché presents strong opportunities for commercial investment, residential development, tourism, and locally owned businesses.
Through ongoing initiatives such as the Investment Site Readiness and Shovel-Ready Lands Initiative, the municipality is actively assessing brownfield and greenfield sites to better position the community for future investment and development opportunities.

Strategic

Strategic Location

The RM of Taché is ideally positioned along major transportation routes connecting Manitoba to national and international markets.
Key advantages include:

  • 20 minutes from Winnipeg, Manitoba’s capital city
  • 
 Direct access to the Trans-Canada Highway
  • Proximity to Winnipeg Richardson International Airport, Manitoba’s largest cargo airport
  • Access to major rail and trucking corridors serving North America
  • Located within one hour of the United States border

This connectivity allows businesses in Taché to efficiently move goods, access regional markets, and attract customers from across southern Manitoba.

Growing

Growing Communities and Population

The RM of Taché continues to experience strong residential growth across its communities, including:

  • Lorette
  • Landmark
  • Ste. Geneviève
  • Ross
  • Dufresne

As new housing developments expand and families continue to move into the region, demand for local services, retail, restaurants, and commercial amenities continues to grow.
This growth provides excellent opportunities for:

  • Retail development
  • Professional services
  • Tourism and hospitality businesses
  • Residential and mixed-use developments
Skilled

Skilled Workforce & Access to Talent

Taché benefits from its proximity to Winnipeg’s large and diverse workforce while also maintaining a strong local labour base.
Key workforce advantages include:

  • Access to Winnipeg’s metropolitan workforce
  • Skilled workers in construction, trades, agriculture, logistics, and service industries
  • A strong entrepreneurial culture with many locally owned businesses
  • Access to graduates from University of Manitoba, University of Winnipeg, CMU, Booth University, Providence University College, and Red River College Polytechnic

This combination of local talent and metropolitan workforce access makes Taché an ideal location for businesses seeking reliable labour and long-term growth.

Agriculture

Agriculture and Agri-Food Strength

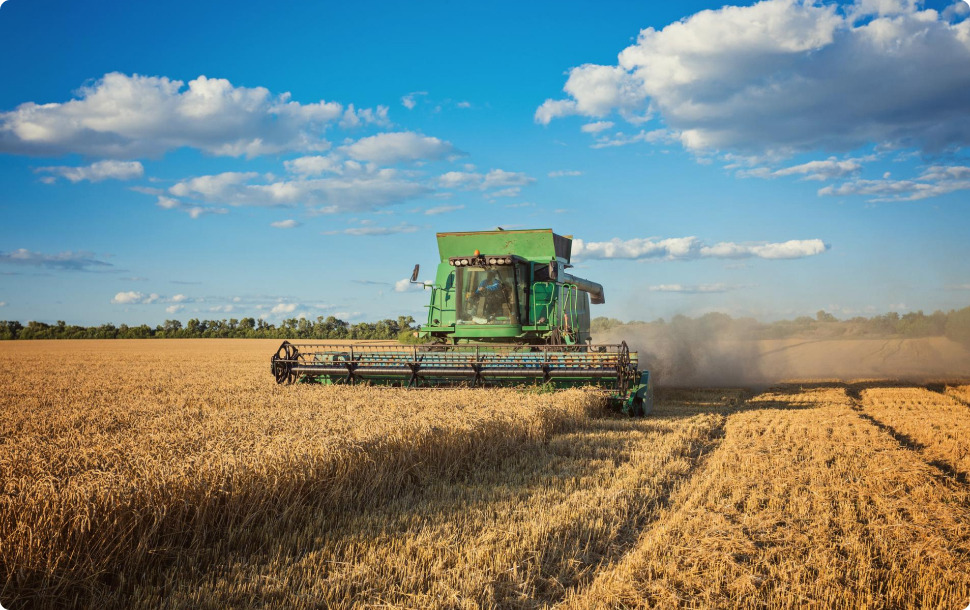
The RM of Taché is located within one of Manitoba’s most productive agricultural regions.
The municipality supports a diverse agricultural economy including:

  • Grain and oilseed production
  • Livestock operations
  • Food processing and agricultural services

The surrounding region continues to see growth in agri-food innovation, food production, and agricultural technology, creating opportunities for businesses that support and service this sector.

Tourism

Tourism & Destination Development

The RM of Taché is home to several growing tourism and recreation attractions that continue to bring visitors to the region.
Highlights include:

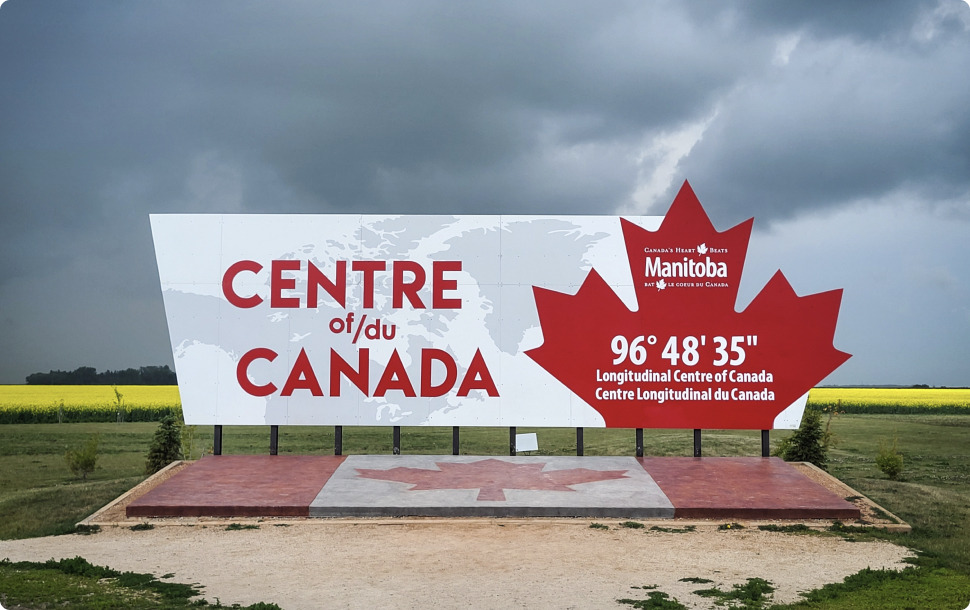
  • Centre of Canada Park, a well-known landmark along the Trans-Canada Highway attracting visitors from across Canada and around the world
  • Seasonal Centre of Canada Markets supporting local entrepreneurs and small businesses
  • Regional trail systems and outdoor recreation opportunities
  • Community events and festivals that celebrate local culture and heritage

Tourism development in the municipality continues to grow through strategic initiatives such as the Taché Tourism Action Plan, helping attract visitors and support local businesses.

Business Friendly

Business-Friendly Environment

The RM of Taché and the Taché Community Development Corporation (CDC Taché) work closely with businesses and investors to support economic growth.
Support services include:

  • Investment and site selection assistance
  • Connections to funding programs and grants
  • Business development support
  • Partnerships with provincial and federal agencies
  • Community promotion and marketing initiatives

This collaborative approach helps ensure that businesses have the resources and support they need to succeed.

A Community That

A Community That Supports Business

Businesses in Taché benefit from strong community support, local partnerships, and a growing customer base.

With its strategic location, expanding population, and welcoming business environment, the RM of Taché offers an ideal setting for businesses looking to start, expand, or invest in Manitoba.

10-Year Building History

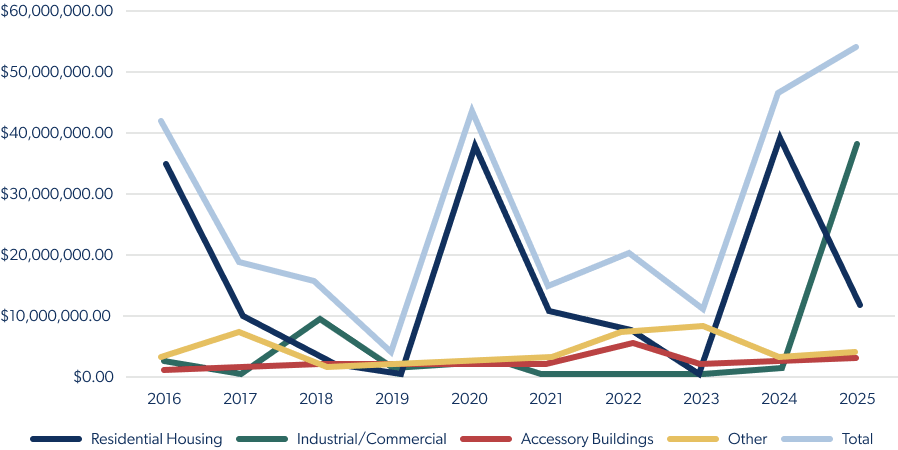
R.M of Taché Building Permit Project Values 2016 - 2025

Year # Residential Housing Industrial/Commercial Accessory Buildings Other Total
2016 142 $34,872,253.39 $2,000,000.00 $975,200.00 $3,343,735.49 $41,191,188.88
2017 153 $10,015,163.52 $270,000.00 $978,900.00 $7,064,503.39 $18,328,566.91
2018 154 $2,583,169.00 $8,737,379.00 $1,277,784.52 $2,227,289.51 $14,825,622.03
2019 132 $0.00 $550,000.00 $641,650.00 $2,033,169.00 $3,224,819.00
2020 144 $37,742,976.83 $2,250,000.00 $766,300.00 $2,783,280.83 $43,542,557.66
2021 206 $10,623,722.00 $0.00 $1,121,122.00 $3,085,717.90 $14,830,561.90
2022 236 $7,567,754.70 $0.00 $5,115,799.88 $7,567,754.70 $20,251,309.28
2023 161 $0.00 $0.00 $1,826,616.77 $8,143,219.50 $9,969,836.27
2024 176 $39,829,636.27 $1,900,000.00 $2,075,615.00 $2,931,675.16 $46,736,926.43
2025 184 $11,443,170.00 $37,504,300.00 $2,527,710.00 $3,036,294.64 $54,511,474.64
Graph

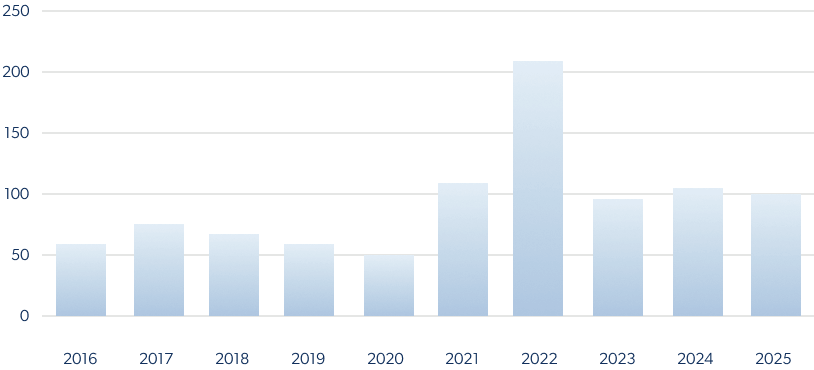
# of Residential Housing Starts

2016 2017 2018 2019 2020 2021 2022 2023 2024 2025
# of Residential Housing Starts 59 73 68 59 50 116 212 93 101 99
Building History

Building Permits by Year

2025
Type Issued Doors/Units  Total Project Cost  Net Permit Revenue 
Total 184 207 $76,913,969.64 $228,084.53
Single-Family Dwellings 65 65 $25,265,665.00 $99,049.75
Multi-Family Dwellings 11 34 $8,580,000.00 $42,916.50
Accessory Building 32 32 $2,527,710.00 $18,919.00
Commercial 8 8 $37,504,300.00 $37,201.03
Other 68 68 $3,036,294.64 $29,998.25
2024
Type Issued Doors/Units  Total Project Cost  Net Permit Revenue 
Total 176 230 $31,415,145.16 $186,134.21
Single-Family Dwellings 39 39 $15,140,300.00 $68,922.70
Multi-Family Dwellings 8 62 $9,367,555.00 $49,535.50
Accessory Building 48 48 $2,075,615.00 $20,231.01
Commercial 3 3 $1,900,000.00 $17,460.00
Other 78 78 $2,931,675.16 $29,985.00
2023
Type Issued Doors/Units Total Project Cost Net Permit Revenue
Total 161 218 $29,681,736.27 $153,302.54
Single-Family Dwellings 27 27 $10,147,900.00 $42,531.00
Multi-Family Dwellings 9 66 $9,564,000.00 $60,048.00
Accessory Building 29 29 $1,826,616.77 $22,680.00
Commercial 0 0 $0.00 $0.00
Other 96 96 $8,143,219.50 $28,043.54
2022
Type Issued Doors/Units Total Project Cost Net Permit Revenue
Total 236 360 $62,758,261.72 $1,530,871.55
Single-Family Dwellings 66 66 $25,757,707.14 $271,632.50
Multi-Family Dwellings 22 146 $24,317,000.00 $1,179,629.50
Accessory Building 28 28 $5,115,799.88 $21,232.50
Commercial 0 0 $0.00 $0.00
Other 120 120 $7,567,754.70 $58,377.05
2021
Type Issued Doors/Units Total Project Cost Net Permit Revenue
Total 206 233 $39,941,615.90 $360,195.15
Single-Family Dwellings 72 72 $26,232,176.00 $230,352.55
Multi-Family Dwellings 17 44 $9,502,600.00 $78,881.00
Accessory Building 27 27 $1,121,122.00 $20,323.85
Commercial 0 0 $0.00 $0.00
Other 90 90 $3,085,717.90 $30,637.75
2020
Type Issued Doors/Units Total Project Cost Net Permit Revenue
Total 144 145 $21,921,278.83 $235,916.15
Single-Family Dwellings 48 48 $15,821,698.00 $173,016.75
Multi-Family Dwellings 1 2 $300,000.00 $4,403.00
Accessory Building 18 18 $766,300.00 $12,985.50
Commercial 3 3 $2,250,000.00 $2,700.00
Other 74 74 $2,783,280.83 $42,810.90
2019
Type Issued Doors/Units  Total Project Cost  Net Permit Revenue 
Total 132 151 $15,422,819.00 $160,164.03
Single-Family Dwellings 33 33 $9,378,000.00 $71,815.26
Multi-Family Dwellings 7 26 $2,820,000.00 $46,545.20
Accessory Building 24 24 $641,650.00 $17,344.70
Commercial 2 2 $550,000.00 $6,559.00
Other 66 66 $2,033,169.00 $17,899.87
2018
Type Issued Doors/Units  Total Project Cost  Net Permit Revenue 
Total 154 175 $26,379,601.55 $157,035.02
Single-Family Dwellings 40 40 $10,657,148.52 $83,242.67
Multi-Family Dwellings 7 28 $3,480,000.00 $22,470.47
Accessory Building 29 29 $1,277,784.52 $19,808.90
Commercial 4 4 $8,737,379.00 $11,543.80
Other 74 74 $2,227,289.51 $19,969.18
2017
Type Issued Doors/Units  Total Project Cost  Net Permit Revenue 
Total 153 179 $23,342,828.39 $151,267.80
Single-Family Dwellings 45 45 $11,529,425.00 $60,686.28
Multi-Family Dwellings 2 28 $3,500,000.00 $2,643.80
Accessory Building 28 28 $978,900.00 $38,177.15
Commercial 2 2 $270,000.00 $4,059.60
Other 76 76 $7,064,503.39 $45,700.97
2016
Type Issued Doors/Units  Total Project Cost  Net Permit Revenue 
Total 142 145 $19,369,561.90 $110,733.20
Single-Family Dwellings 54 54 $12,110,626.41 $83,049.84
Multi-Family Dwellings 2 5 $940,000.00 $6,238.75
Accessory Building 26 26 $975,200.00 $9,555.95
Commercial 1 1 $2,000,000.00 $0.00
Other 59 59 $3,343,735.49 $11,888.66